
Google has announced a new update that will make the Sheets application more efficient. With this innovation, users will be able to speed up data analysis and create visualizations more easily with artificial intelligence-supported tools. So how will this development change business processes? Here are the details…
Data analysis feature is available for Google Sheets
Google has made an important update that will make the work of Sheets users easier with the Gemini support it announced last month. This feature is a big step especially for professionals who make data-based decisions in the business world. Now, Google Sheets offers users the opportunity to analyze data faster and create advanced visualizations with Gemini support.
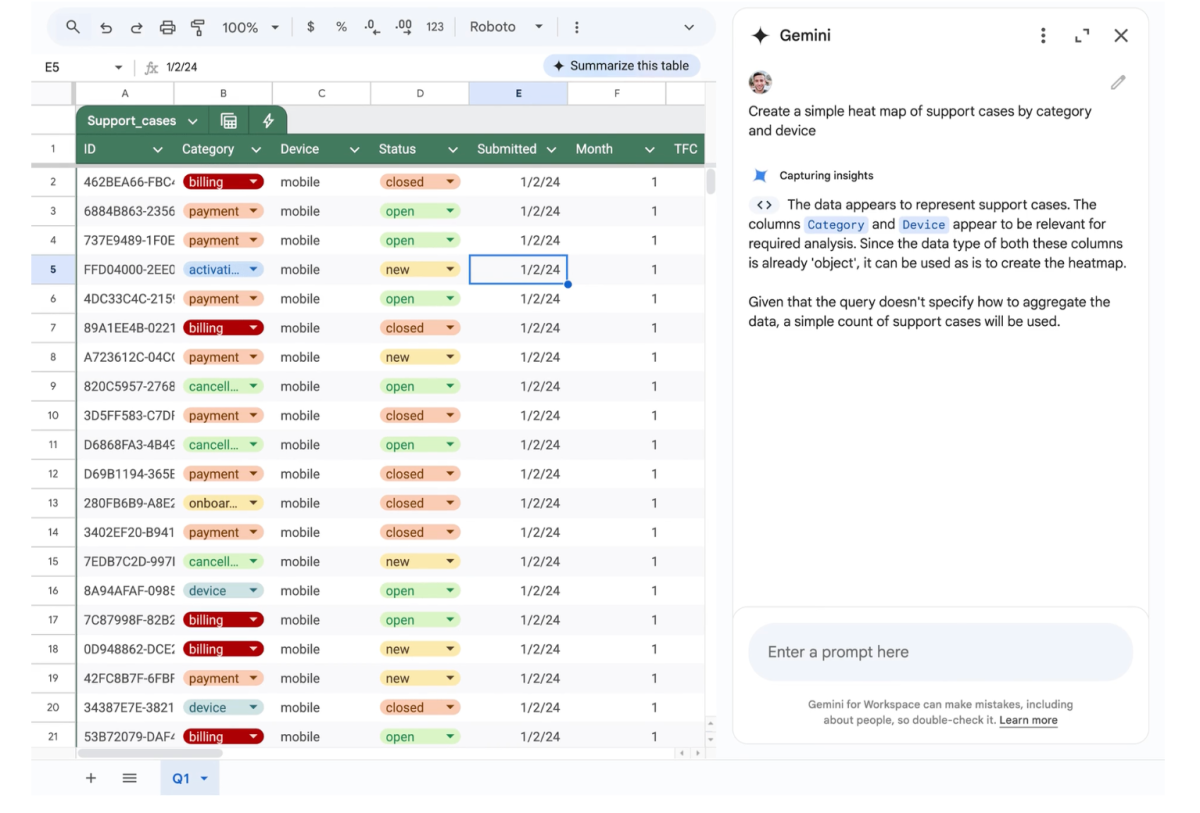
With the new feature, users will be able to obtain insights such as trends, correlations, and outliers from data sets. In addition, users will now be able to create advanced visualizations such as heat maps and add these visuals directly to pages. For example, a user can direct Gemini with commands such as “Estimate my net income for the last quarter” or “Visualize support cases by category and device with a simple heat map.”

Elon Musk Expands Family Amidst Personal and Professional Turbulence
This update not only analyzes data, but also allows data analysts to write Python code and analyze the results with multiple layers of analysis. For simple requests, Gemini can respond with Excel formulas. Google emphasizes that for this innovation to yield accurate results, data must be in a consistent format and complete.
This feature is now available for all Workspace business users.
What do you think about this? Share your thoughts with us in the Comments section below.